-
3-minute read
-
20th July 2016
How to Use Tables and Charts in Microsoft Word
You’ve done the hard work in the laboratory, taking precise measurements and recording them diligently. Now comes the time to write up your results.
But how should you do this? Is there not some kind of clear, simple and visually striking way to present your data in a Microsoft Word document? Friend, you’ve come to the right place.
In today’s blog post, we run through the basics of adding (and formatting) charts and tables in Microsoft Word.
Adding a Chart or Graph
Microsoft Word enables adding charts and graphs of many kinds in your document, from simple pie charts to 3D surface graphs. To do this, simply:
- Place the cursor where you want your chart to appear
- Go to “Insert” on the main ribbon and select “Chart” from the “Illustrations” section

- In the new window, pick the type of chart you want in your document and click “OK”
- Your chart will now appear in the position selected and an Excel spreadsheet window will open (called “Chart in Microsoft Word”)
- Edit the values and labels in the Excel window to reflect the data required for your chart
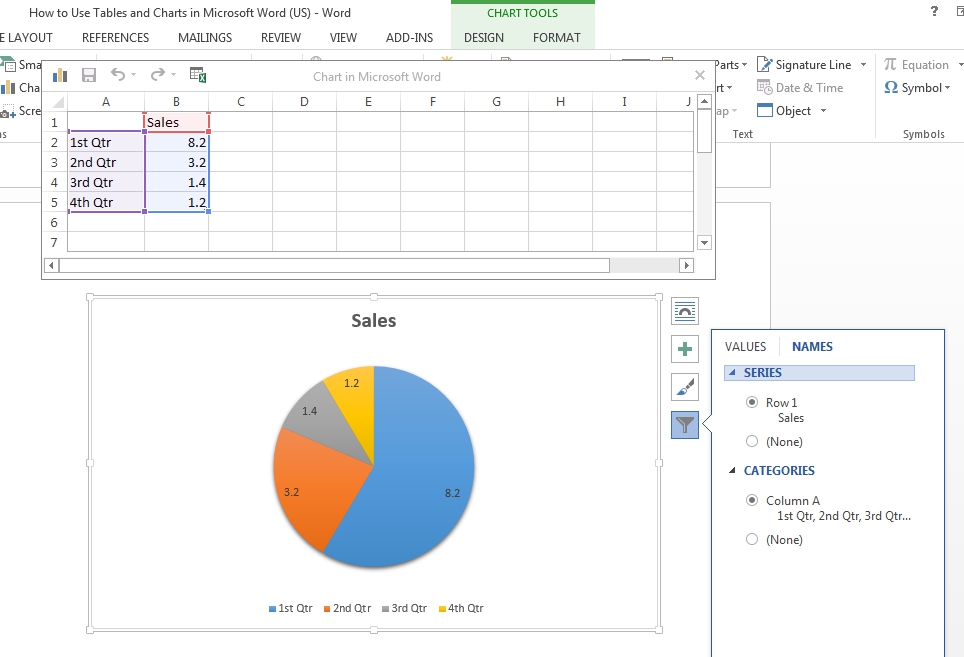
- To change the chart title, simply double click and type (you can also add a caption by right clicking on the chart and selecting “Insert Caption…)
You can customize your chart further via the buttons that appear when you click on the chart (options include layout, chart elements, chart style, colors and the data you wish to be visible).
Linking Excel and Word
Alternatively, if you already have an Excel spreadsheet containing a chart, you can copy and paste this to a Microsoft Word document using the “Paste Special…” option on the “Home” tab (to select this, click the small arrow at the bottom of the normal “Paste” button).
Find this useful?
Subscribe to our newsletter and get writing tips from our editors straight to your inbox.
Subscribe to Beyond the Margins and get your monthly fix of editorial strategy, workflow tips, and real-world examples from content leaders.
To do this, open the Excel spreadsheet in question and copy the relevant chart. Next, select “Paste Special.” You can then add the chart to your Word document by selecting “Paste link” and “Microsoft Excel Chart Object”.
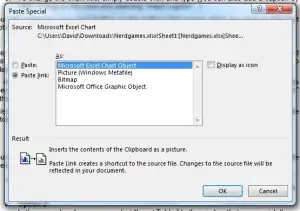
This links the chart in the Word document to the one in the original spreadsheet. It will then update automatically if the values in the spreadsheet are changed.
Adding a Table
You have various options for adding tables to a Microsoft Word document, so we’ll stick to the three simplest here.
- Option 1
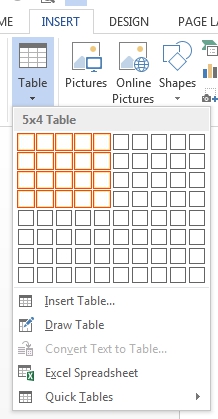
Go to “Insert” and select “Table.” This opens a dropdown menu with a grid. You can then pick the number of columns and rows required.
- Option 2
In the same dropdown menu, select “Insert Table.” In the window that opens, pick the number of columns and rows required. - Option 3
Draw your own! In the “Table” menu on the “Insert” tab, select “Draw Table.” This lets you draw and edit tables by hand
If you click on an existing table, you can edit its design and layout via the “Table Tools” tab that appears on the ribbon.